
"Trace-viewer to the rescue" - Google's Trace-viewer as a tool for code profiling
Analyzing code performance is a difficult task. There are a lot of code profilers on the market, each with unique characteristics. It’s hard to know which one is best for your needs. Even after choosing one, making it work with your code is not straightforward - it can take time to incorporate a profiler before you start using it. Most times, the profiling itself inhibits performance.
This post will discuss how we utilized Chome’s Trace-viewer, a visualization tool for profiling processes in web pages, to get a fast and easy profiling ability on a real-time embedded system.
The need for visualization
Sometimes when writing a code, one can simply know it works by taking a peek at the logs. In real-time, there is a point where it becomes too complex and runs too fast to spot bugs by watching the output.
Moreover, our system comprises several independent modules that use shared memory and events to work in sync. Therefore, we don’t have a single log file where you can inspect the system’s behavior as a whole.
We had performance issues on a multi-module system. We didn’t know what caused them, where to look, and lacked the tools to find out. When you try to tackle problems that you are unfamiliar with, it is helpful to visualize as much data as possible to identify where those problems are. Visualizing helps you recognize trends and bottlenecks and gives you a deeper understanding of the code. This is true even if you are the writer of the code.
We were at an early stage of development, and we didn’t want to make the investment needed to start working with a full-scale profiler. We needed a profiling method. It had to:
Show how a large number of events across multiple modules affect each other.
Be easily incorporated into the codebase
Have a minimal effect on the runtime itself
Trace-viewer
After some research, we came across Trace-viewer:
Trace-viewer is a tool for generating a timeline of events during a run of a web page. You use it for diagnosing and analyzing performance and behavior. It is a part of chrome and chromium browsers and is accessible via chrome://tracing.
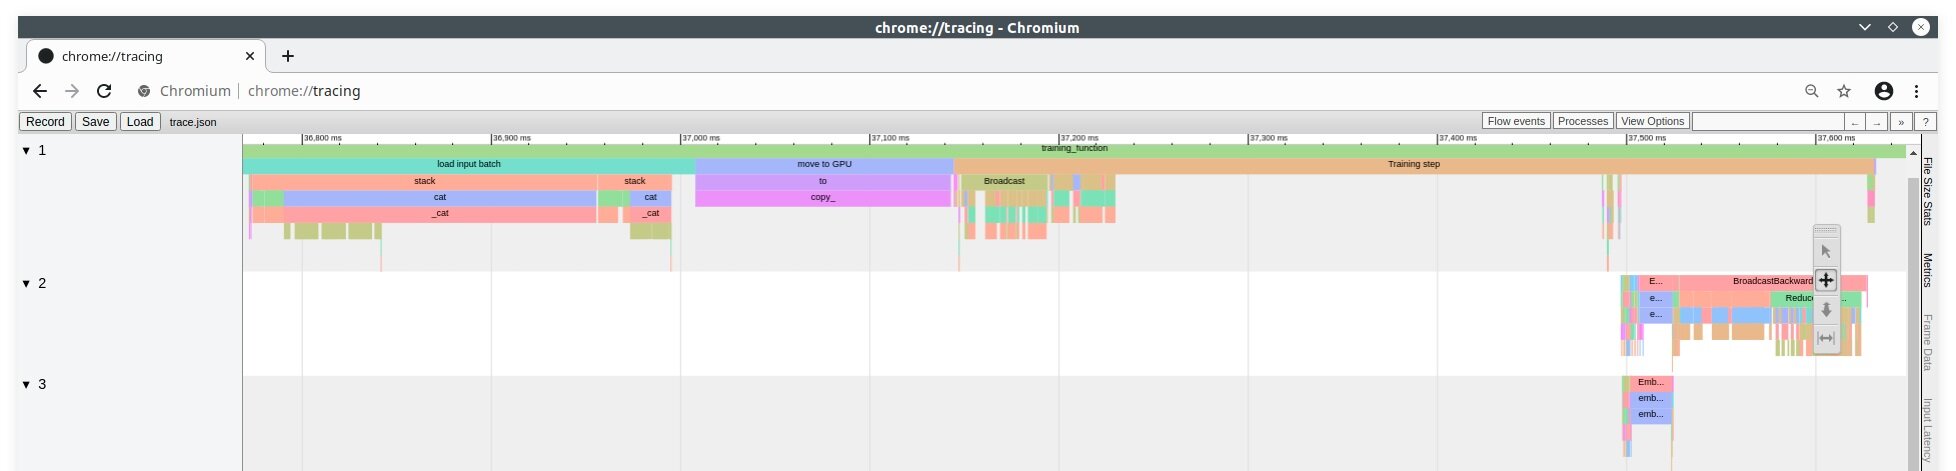
fig.1 - Trace-viewer
Basic functionality:
The X-axis is time - going down to the microsecond. The Y-axis is the process and\or thread on which the event took place.
Each event is displayed as a bar on the timeline. It has a beginning, an end, and metadata describing the event.
You can zoom in\out and traverse over the timeline, measuring event duration and derive conclusions based on how events behave in adjacency to other events.
You can pair each event with descriptive data.
Trace-viewer is used most commonly by recording events at runtime and offline by uploading JSON formatted text files. Its format is relatively simple - a large JSON object made of lots and smaller objects representing events.
There are two main types of events:
A timed event, with a beginning and an end, is represented by two entries of a JSON object, each one with a timestamp. Those entries don’t even have to come in a specific order.
A transient event happens at a certain point in time and doesn’t have a length associated with it. This is represented by a single entry of the JSON object.
Once you understand this simple way of describing events, it all comes down to generating an entry with a timestamp whenever you have an event in your code you want to measure. One limitation of using this tool is - events must be nested. If event B starts after event A, it must end before A ends. But it can easily have a workaround with a bit of creativity.
After selecting the tool, there is a new challenge: quickly reporting these events out of our code without polluting it.
Integrating into our system
We’ve implemented a library that allows the programmer to put measure points throughout the code -
Each start and end measures make a timed event.The system collects the events in batches and sends out a combined JSON message using Redis protocol.
Having the metrics be sent out in batches made reduce the impact of the profiling process. The profiling process has minimal effect on the whole system performance.We paired each event with relevant data such as operating speed, sizes of data structures, etc.
We started off using those measure points to measuring large chunks of our code and worked out way down to shorter, more precise events that are of interest. By the end, we had most of our modules mapped out to events. We could now “record” a run of the system, stop and view the timeline to analyze its performance.
We could see how specific modules behave when other GPU\CPU heavy operations are happening in parallel.
We could measure how much time it took, for input, on one side of the system to be output 3-4 modules down the pipeline.
We could roughly understand how much we utilize the system by measuring the idle parts of the graph.
We now have a visual proof of assumptions and design choices we made when writing the code.
Visual tools help to answer questions such a “how much time should we allow an operation before declaring timeout?”; “how many threads should be put to work on a task before suffering overhead?”
Those questions are suddenly made clear and can be deduced from measuring time intervals on a graph.
From that point on, we could see what was going on in each run at a single glance.

fig.2 - multiple threads
In fig.2, for example, we can see 5 threads receiving jobs and performing tasks.
We can see how certain tasks took longer when run in parallel to other tasks.
We can measure to see if there is a direct proportion between the increase of runtime and the number of tasks run parallel.
we can visually understand how fast we can run with this number of threads before failing to keep up
One of the biggest benefits of visualizing a problem is the ability to detect patterns. A task can usually take ~10ms, and once every 500 times, something unexpected happens, and it suddenly takes 80ms. 80ms might be well within the definition of correct behavior, so you might never detect this anomaly. Using a visualization tool such as this - this anomaly pops out.
Our mind is good at detecting changes:_)

fig.3 - congestion and transient events
In fig.3, we see marked with a red rectangle, a point where hardware strains caused congestion.
Fail points are reported as transient events and are visible as vertical lines. In contrast to timed events, line marking transient events stays the same width no matter how zoomed in or out you go, so they are always visible.
The congestion around that area might be missed if not for a visual aid such as this.
Future work
A tool such as Trace-viewer does not stand alone as a debugging tool. It simply points you in the directions of problems, so you can be focused when using more in-depth tools. You might want to keep improving on what events you are measuring, how many of them, and what data you are sending. With each event, you can use tools to automatically parse those messages and outputs and make a report pointing out anomalies, bugs, behaviors, and trends.
But in an early stage, when all those tools are not yet in place, and you are still learning how your code behaves - a tool such as this can help a lot and deepen your understanding of what is happening under the hood.
Conclusion:
Profiling your code gives you a better understanding of how well it runs. It is advisable to profiling the code as soon as possible. However - It demands considerable resources. In the early stages of development, most of the effort goes into writing new code rather than testing the existing one.
Using tools such as Trace-viewer to visualize performance can bring lots of value for a minimal cost. It helps you see the bigger picture of how different modules work together and helps you make better design and implementation choices.
Nir Erez
Software developer at Greeneye technology